In the fast-paced world in which we live, it seems that nobody has time to read a full research article any more. With so much reading done on mobile screens now, many researchers and journals are moving to visual abstracts to grab readers’ attention.
What’s a visual abstract? Exactly as it sounds – a illustration or graphic that quickly summarize findings published in full-length, peer-reviewed manuscripts. The idea is the visual abstract brings more people in to read the full paper.

A team of physicians, editors, and creatives recently published a guide to using Visual Abstracts to Disseminate Scientific Research.
As of writing this post, there are at least 60 journals using visual abstracts, across many disciplines. Even if the journal in which you’re publishing doesn’t typically make visual abstracts, authors can often create their own for upload during the submission or publication process, or use it in their own blog/tweet/post.
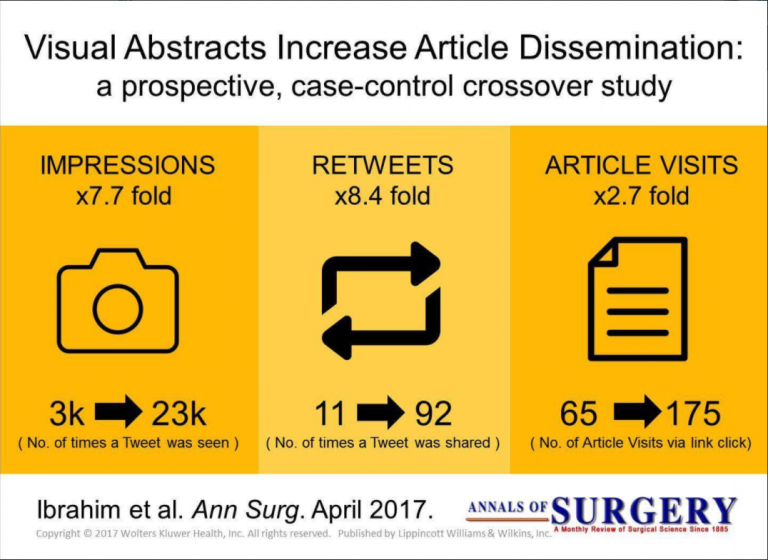
A study published in Annals of Surgery showed that tweets that used visual abstracts garnered a significant increase in Twitter impressions, retweets, and (most importantly) visits to the article website compared to text-only tweets.
With the improved online metrics, it may be worth considering a visual abstract to tell the world about your next manuscript. Want to see some recent examples? Check out the #visualabstract feed on Twitter.